PRODUCT
Everything you need to trade by your own system.
Build rules, test them honestly, size them, run them as a portfolio and follow them every day, in your browser on a computer or a phone.
Rules as detailed as your thinking.
If you can say it, you can test it. Write your idea as rules from price, volume, moving averages, RSI, MACD, relative strength and earnings. Add rules on the index, the stock’s own sector or a higher timeframe. Join everything with AND/OR. No code.
Examples
- Buy when a strong stock pulls back to its 20-day average.
- Only while the S&P 500 and the stock’s own sector are rising.
- Only if its earnings and revenue are growing faster than most companies’.
- Sell at a 15% gain, at a stop two ATRs below entry, or after 20 days.
- hourly or daily systems
- check the weekly chart in the same rule
- Nasdaq-100, S&P 500, US 1000 and crypto
- copy a system to another market in one click
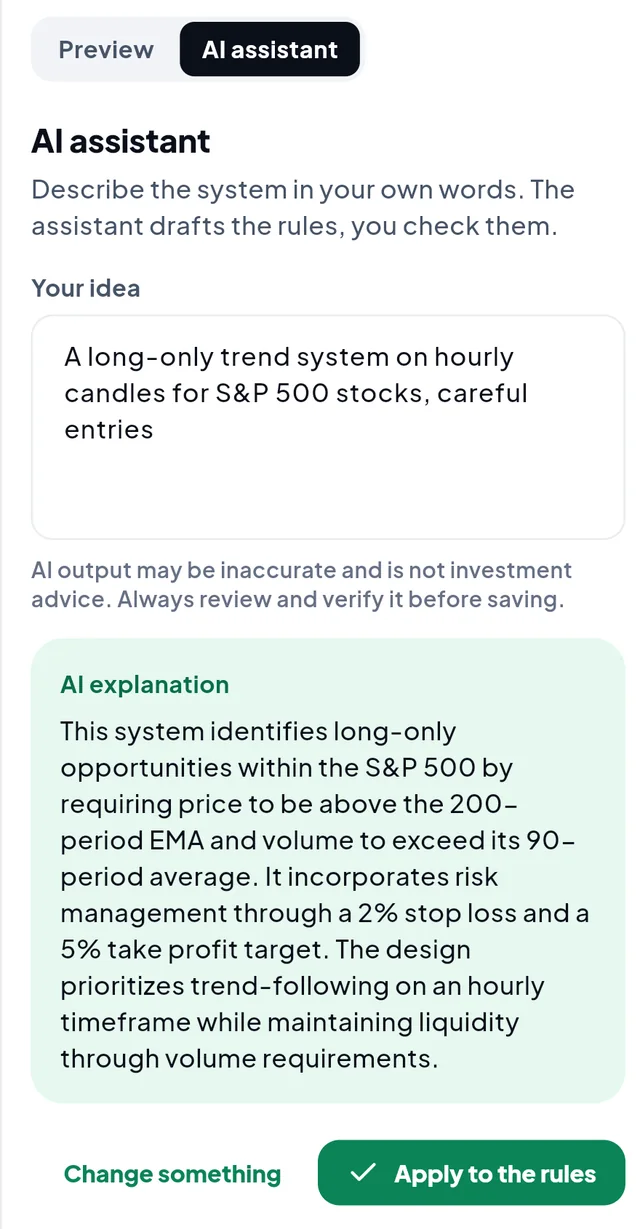
Describe it. AI drafts the rules.
Write the idea in your own words: “a long-only trend system on hourly candles for S&P 500 stocks, careful entries.” AI fills in the rule builder and explains what it set up. Later, ask it to change something: “hold positions for less time” or simply “improve it”. It reads the rules and their statistics before it proposes a change.
AI drafts, you approve.
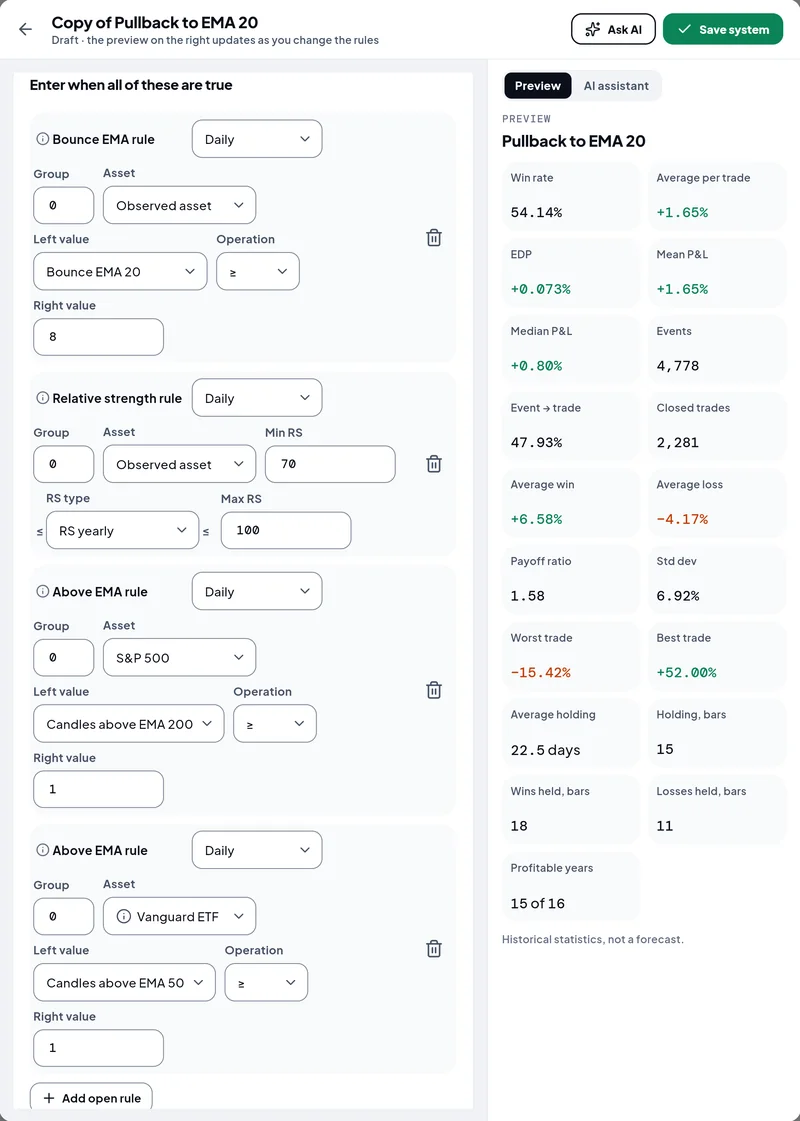
Statistics that move with every change.
Change a rule and the results update in seconds: how often it fired since 2010, how often it won, the average result per trade, the worst trade and how long positions were held. Then check year by year whether it worked every year or in one lucky one. 49 measures in all.
Trade explorer
Open any historical trade on a candlestick chart with its indicators and see exactly why it entered and exited.
Compare versions
Copy a system in one click, change what you want, even just one number, and compare the copy with the original. Every copy keeps a link to the system it came from.
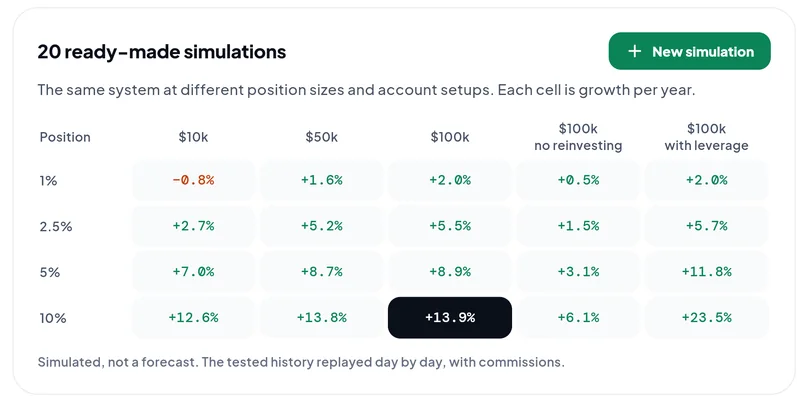
Twenty simulations before your first order.
Before you risk money, APAIIR replays the system day by day with capital and commissions, at four position sizes on five account setups, including one that never adds to a position you already hold. That is 20 ready-made simulations at once. You see which size the system can carry and which one breaks it. Then run your own with your capital, size, dates and leverage.
Your systems, running together, every day.
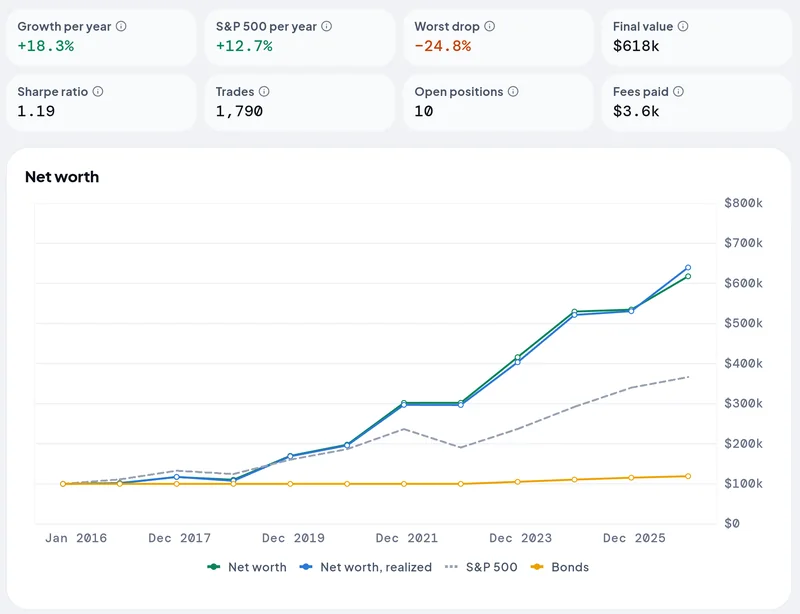
A portfolio is where your systems live. First test them together on history, on the same money and within four limits, for example never more than 5% in one stock. Then keep it running: every day it collects the orders your systems produce and tracks your real result.
- several portfolios
- positions kept per system
- profit, deepest fall and month-by-month results
- comparison with the S&P 500 and bonds
What your system says, every day.
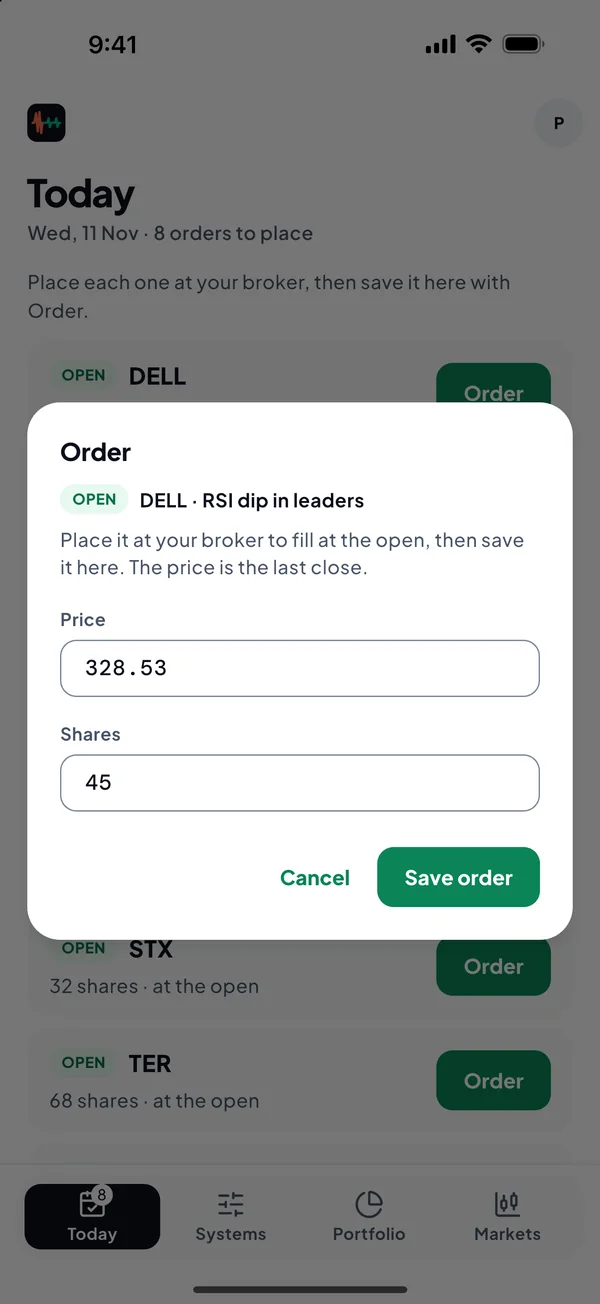
When the trading day ends (or every hour, for hourly systems), APAIIR checks your systems and tells you what to open, what to close and how many shares your limits allow. A notification brings you there. After you place the order at your broker, confirm it in APAIIR, with price and size already filled in.
- what to open and close
- how many shares
- what is over your limits and why, under See over limits
- every order and transfer on record
Support and resistance, drawn for you.
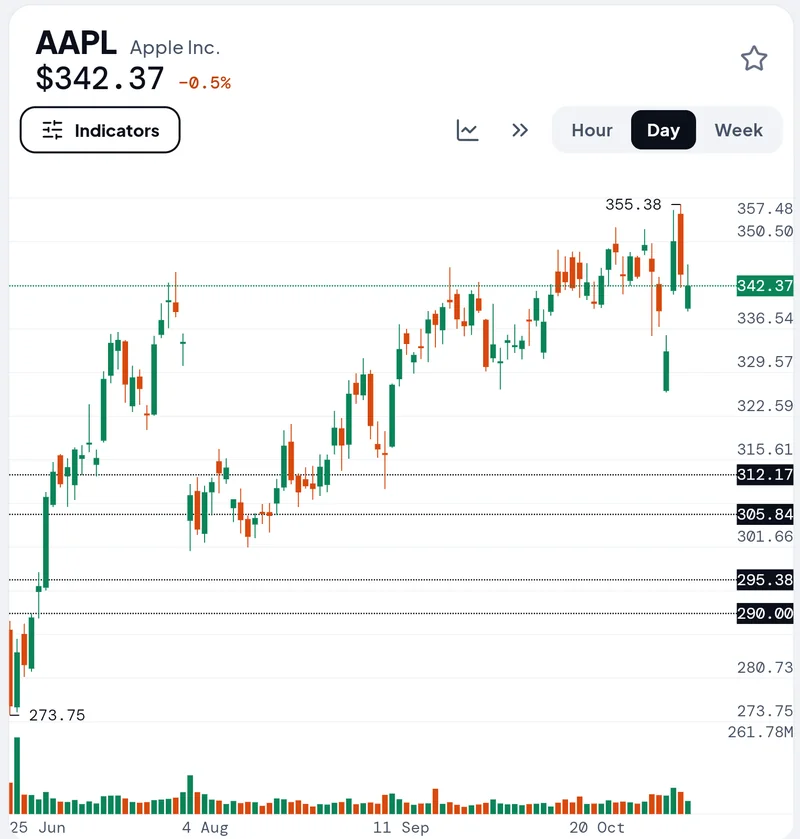
APAIIR finds the levels on every chart automatically, on hourly, daily and weekly candles, so you never draw them by hand. Charts for stocks, indices, sectors, crypto and commodities, a watchlist and prices before and after the main session.
History you can check.
Daily and weekly data since 2010, hourly since 2023. Splits and delistings are applied to history. What the tests include and leave out is on the Methodology page.
Works in your browser, on a computer or a phone. Subscriptions are managed in your account.